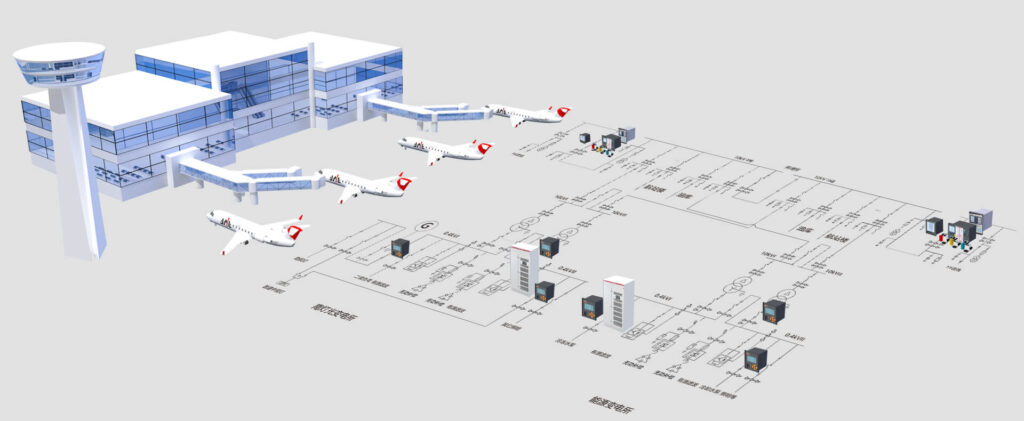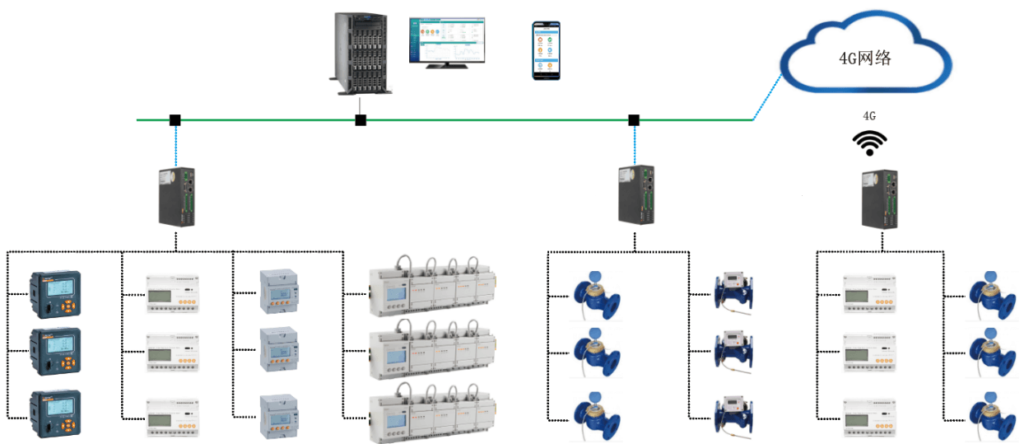
With carbon peaking and carbon neutrality becoming the main tasks of the government, civil aviation airports, as large buildings with intensive energy consumption and complex energy consumption,
To effectively reduce energy consumption, reduce energy costs, and avoid the phenomenon of "emission, emission, drip and leakage" in the process of energy use, the implementation of comprehensive energy efficiency evaluation is a very necessary management method.
What's the Difficulty of Civil Airport Energy Consumption Management
What's the Highlight of Civil Airport Energy Consumption Management Solution
How to Configure the Civil Airport Energy Consumption Management Solution?

What's the Solution for Civil Airport Power Quality Management
It mainly displays the basic information of the selected buildings, the comparison of energy consumption of each category of buildings, the hourly trend of the day, the daily trend of the month, and the histogram of peak, flat and valley energy consumption by time period. Energy type can choose electricity, water, renewable energy and other energy types, and convert standard coal.
Statistical report of daily, monthly and annual energy consumption of all buildings under the current account, which can be displayed in the form of report or chart, and can be exported and saved in excel form.
You can choose to view the year-on-year and quarter-on-quarter analysis and comparison of the current building energy consumption data, and you can choose the daily/monthly/yearly cycle for comparison, and display the comparison results through histograms and percentage data.
Graphically display the current energy consumption flow of the building, hover the mouse to display the energy consumption data of the current area or loop, and the start date and deadline can be selected.
You can choose to view the energy consumption trend of a specific circuit, including daily average load curve display, daily energy consumption comparison data, energy consumption data in the past 48 hours, past 31 days, past 12 months, and past 3 years.
The system can set the unit price of energy consumption, and display daily, monthly, and annual energy consumption bills through reports.
You can choose to view the primary map of the power distribution system of the selected building, and display the current telemetry, telesignaling data and status of the power distribution system in the primary map.
Display the lighting sockets, air conditioners, power and special electricity consumption of the current building, and display the energy proportion, year-on-year comparison and sub-item energy consumption trends through pie charts and bar charts.
Display the current energy consumption of each area of the building, and display the energy proportion, year-on-year comparison and sub-item energy consumption trends through pie charts and bar charts, which can be distinguished by buildings and floors.
Analyze the energy safety of commercial centers by monitoring the leakage current and cable temperature of power distribution circuits. Install leakage detectors and temperature sensors in commercial buildings, office buildings, hotel floors, distribution box incoming and outgoing circuits, and install leakage detectors and temperature sensors in other building incoming lines.
2014/35/EU
2014/30/EU
 Standard Lead Time:
Sample: 2 days
Bulk: 1 month
CE-RED, IEC, LVD, EMC


2014/30/EU
EN IEC 61000
2014/35/EU
EN IEC 61000
EN61010

2014/30/EU
EN IEC 61000
IEC 62052
IEC 62053


Kindly Fill out the Form below and tell us more about your Requirements,
We would like to provide Suitable Solution for You.
or Send us Email directly, [email protected]


Kindly Fill out the Form below and tell us more about your Requirements,
We would like to provide Suitable Solution for You.
or Send us Email directly, [email protected]